You May Find It Interesting

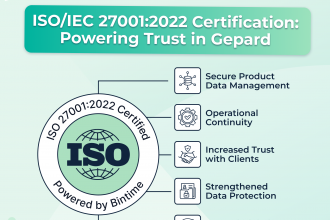
Bintime Achieves ISO/IEC 27001:2022 Certification, Raising the Bar for Gepard PIM Security
Our parent company, Bintime, has officially achieved ISO/IEC 27001:2022 certification, the world’s leading standard for information security management.
Read more
Gepard PIM Product Updates August 2025: Smarter Pipelines, AI Shopping Agents & More
Discover Gepard PIM’s August updates: AI shopping agent, smarter pipelines, Amazon category mapping, compliance tools, and faster testing.
Read moreProduct Content Syndication: Tools, Services & Strategy for Multichannel Growth
Define product content syndication and aggregation. How retailers and brands can benefit from syndication and distribution of product content.
Read moreFrom Data Chaos to Global Harmony: Meet Gepard’s AI Mapping Agent
Gepard’s AI Mapping Agent does both jobs: Builds taxonomies and data models. Maps them across suppliers, systems, sales channels.
Read moreProduct Taxonomy Definition: Mapping, Creation & Best Practices
Find out what is product taxonomy, learn about its best practices and why it’s important for eCommerce business.
Read moreHow Data Validation Transforms eCommerce Businesses
Read about the impact of data validation on eCommerce companies. Learn how to validate data to generate revenue and get a deeper understanding of your customers.
Read moreProduct Data Mapping: Framework, Automation & Best Practices
Discover what is product data mapping and how Gepard helps automate it. Learn frameworks, tools, and AI-powered solutions for eCommerce success.
Read moreHow to Cut EU Chemical Regulations Compliance Time by 90%
Automate REACH, CLP & SCIP compliance with Gepard ECHA Connector. Cut risk, reduce manual work & ensure EU chemical regulation readiness.
Read moreGepard PIM Product Updates July 2025: Product URL Scraping and More
Our Gepard PIM summer release emerges from a structured development cycle underpinned by thorough technical reviews and measured iteration.
Read moreThe EPREL “Gotchas” we’re Already Seeing (and How Teams are Fixing Them)
Learn how brands adapt to the NEW EPREL categories: smartphones/tablets labels, PIM workflows, QR links, audits, fines.
Read more